
Statistical Perspectives
A Markov Model to Study College Re-opening Under Covid-19
This article was first shared on ResearchGate.
Jorge Romeu
1.0. Introduction.
This Markov Model studies the problem of Re-opening Colleges during Covid-19 Pandemia. We wrote two Markov model papers before:
A Markov Chain Model for Covid-19 Survival Analysis
We assumed everyone would become infected and die, and in A Markov Model to Study Covid-19 Herd Immunization we assumed all survivors would become immune.
We have also previously written An Example of Survival Analysis Applied to Covid-19 Data. Also Multivariate Statistics in the Analysis of Covid-19 Data, and More on Applying Multivariate Statistics to Covid-19 Data. These tutorials can be found here (statistical methods & tools for classification of states, regions, etc.), here (according to levels of infection and other metrics), and here (on socio-economic issues affected by Covid-19.) We have also written on the use of Design of Experiments Applied to the Assessment of Covid-19, an example of the use of DOE for assessing and controlling the levels of infection in states.
We have written an evaluation of the results of 25 years off-shoring American jobs, and its impact on preparedness to fight the Coronavirus Pandemic, as well as on using methods of reliability data analysis, FTA, and FMEA in the design and operation of ICU units and Ventilators. All above-cited papers are in our ResearchGate page here. The above work constitutes our pro-bono collaboration to fight Covid-19, based on this proposal.
2.0 A Markov Chain for Re-opening College, with Two Absorbing States.
We analyze the situation of Re-opening College under Covid-19, using a Markov Chain defined over a nine element state space. The proposed Markov Chain models a non-recurrent process that moves through a number of Transient states (1 through 7) eventually leading to one of two Absorbing States (8 & 9: Expulsion or Coursework Completion) where students remain forever.
Because the state space contains both transient and recurring (absorbing) states, instead of steady state solution we obtain the long run probabilities of Expulsion or Completion the Course, when starting in any of the Transient states. Their corresponding expected times are irrelevant here.
Let {Xn; n >= 0} be a Markov Chain over a nine-element State Space defined as follows:
(1) Arrival to Campus and Covid- 19 testing;
(2) Infected students go into Isolation units;
(3) Some students are placed in Presential courses;
(4) Other students are placed in Distance Learning courses;
(5) Some students who violated Code are placed in Suspension;
(6) Some students become infected with Covid-19, but are not detected;
(7) Some students violate code but are not detected;
(8) Absorption: Some students are Expelled from College
(9) Absorption: Other students Complete their Semester
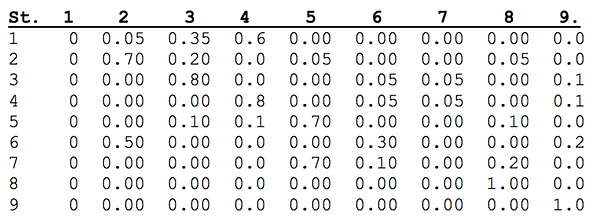
The Transition Probability Matrix P for this Markov Chain is:
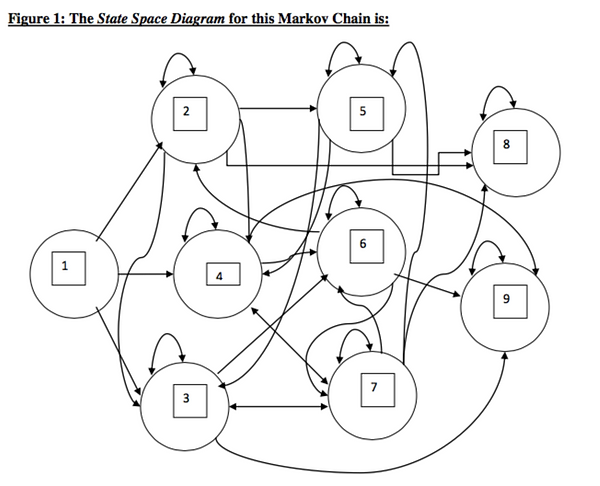
The corresponding state space diagram is below:
The Markov Chain unit time is a day. Transitions refer to the State changes that occur from one morning to the following morning. Students arrive (1), are tested and distributed into isolation (2) if infected (5%), Presential (3), and Distance courses (4). Some students become infected (6) and are again Isolated (if detected) or remain, asymptomatic, until the end of the semester (possibly spreading the disease). Some students violate Code by partying, gathering, etc. (7), and some get caught and are Suspended (5) or become infected (6), while others are not detected and return to their courses. Some isolated students break their status, are caught and are Suspended (5). Some Code violations are so blatant that students caught are Expelled (8), as also are some students that break their Suspension. Students Expelled do not return to Campus. All other students finish their semester (9) after completing Isolation, Suspension, and Distance or Presential coursework.
The transition rates depend on environmental conditions (e.g. infection rates, social distancing, mask compliance), on modeler’s experience and concomitant information. Specific transitions between states also stem from modeler’s experience, information and judgment call. All such adjustments constitute the actual tuning up of the present Markov model, when used by others.
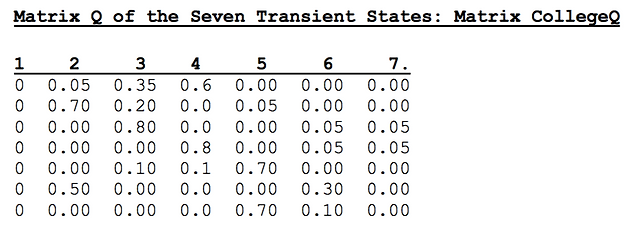
We obtain, from P, the Sub-Matrix Q, corresponding to the seven Transient states:
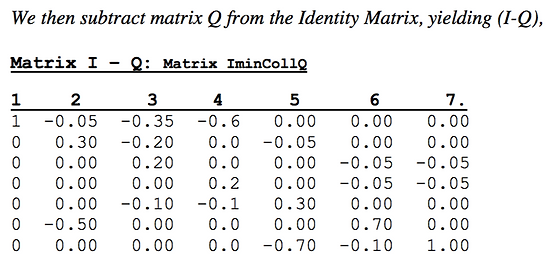
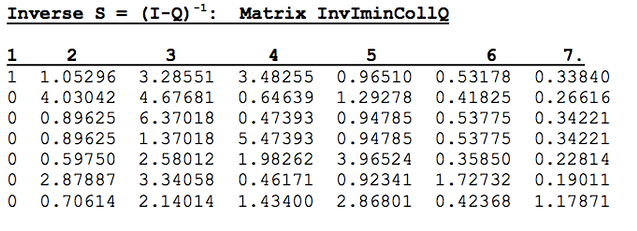
We invert the above: Matrix inverse S = (I-Q)-1
The Potential Matrix (of which S is a sub-matrix) contains the Long-Run Sojourns (the average number of visits) to each of the States (matrix columns), when starting from any other of the States (represented by the matrix rows). The Sojourns that occur outside Sub-matrix S are either Zero (if the states cannot be reached) or Infinite (if it is to an Absorbing state).
State Sojourns and times to absorption, in the context of the present problem, are of small value, as the coursework time is pre-determined (16 weeks) and students either complete it or not.
3.0 Results for the Two (Expulsion or Coursework Completion) Absorbing States
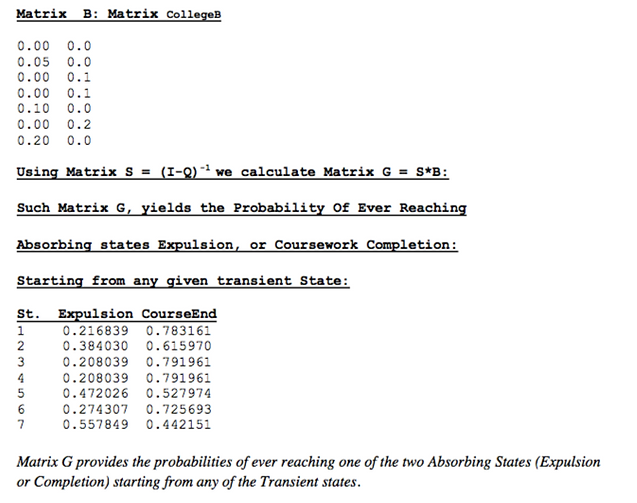
As explained above, state sojourn times are nor relevant, in this case. We calculate instead the Probabilities of Expulsion and Coursework Completion, starting from any of the transient states. We calculate these probabilities using Matrix B, a sub-matrix of all transient states. B is constructed by taking the rows and columns of P, above the Identity sub-matrix corresponding to the two Absorbing states (last two rows).
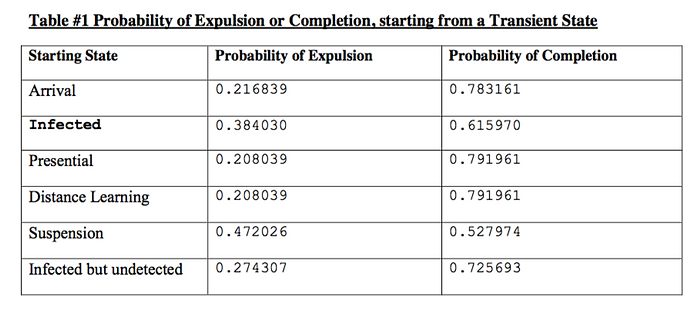
Notice how the Probability of Expulsion, the day of student first arrival to Campus, is 0.217 (and that of completing the course is, of course, 0.783). However, the Probability of Expulsion, if the student is detected as infected, and then isolated, is 0.38. The Probability of Expulsion, if placed in Suspension, is 0.47. Increase may occur due to having more opportunities to run into problems with the administration (e.g. breaking Isolation or Suspension) leading into student Expulsion. On the other hand the Probability of Course Completion is, from most states, close to 0.8, except for students that have been infected or suspended. In particular, the Probability of Completing the Course, for students that have been infected with Covid-19, but have not been detected as such, is 0.62. This means that such may be participating in college activities, possibly infecting inadvertently others. This result underlines the need of retesting for Covid-19, multiple times. Transition (infection) rates depend on student behavior and on college prevention plans. They can be changed accordingly, to assess best, worst and average cases, and take decisions. Such modifications of the models are used in what Operations Researchers call the What If Game (e.g. what would happen if infection rate were 9% instead of 4%) to evaluate alternatives.
4.0 Discussion
This Markov model, due to its specific State Spaces Ej and its transition probabilities (Xij for i,j = 0, … , n) is particularly useful to assess the effectiveness of reopening plans. Different infection (transition) rates help study their impact on the probabilities of Expulsion and Course Completion. Infection rates depend on student compliance with all community and public health measures, such as face covering, social distancing, etc.
By assigning different values to the infection (transition) rates, their impact on the Re-opening plans can be assessed and compared.
Transition rates and number of States depend on student behavior (which in turn is impacted by community spread and public health measures such as face covering, social distancing, etc.) as well as on specifics of the reopening plans. By using different transition rates, the resulting Reopening plan Logistics problems can be assessed and addressed.
Probabilities of Expulsion and Completion, starting from different States Ej, can be combined with student registration information to estimate the number students completing coursework that result from different scenarios and plans, thus helping select the most efficient one.
Statistics and mathematical models are tools that help answer practical questions, as well as to compare the performance of different alternatives, in a more objective, non-partisan way.
Further readings about Markov Processes can be found in the Bibliography Section.
5.0 Conclusions
The Markov Chain model developed in this paper, its transition rates, and specific transient and recurrent states, were built based on our readings about Covid-19 and our 45+ years of statistics and O.R. experience in modeling and data analysis, working for several research and academic organizations. This author is not a public health specialist, but a statistician. Our intent is to place the model in the hands of the specialists, so they can redevelop it with better information.
This model can be improved by those having better information by modifying the state space, the transition rates and/or transition directions, among other modifications. Alternatively, it can be used as an illustration, if building their own. Once updated and fine tuned, or rebuilt differently, the Markov model can be used by college authorities to assess and improve their reopening plans, by faculty and students to assess their risks when participating in such re-openings, and by the government authorities to assess the validity and safety of such plans, to allow or proscribe them.
Results from the Markov Chain model, most useful for Covid-19 problems, have to do with the probabilities of absorption (Expulsion and Completion) and are given in Section 3.0.
Changing the transition rates in the Markov Chain (Section 2.0) helps study how they affect the absorption probabilities (Expulsion and Completion) starting from each state, and thus compare efficient and inefficient plans. This may also help establish an acceptable community infection rate under which such College Reopening operation presents a lower risk (and vice-versa).
Finally, our statistical models are not intended to compete with, but to complement and enrich, the models developed by Epidemiologists and other Public Health professionals.
Bibliography
Taylor, H. and S. Karlin. An Introduction to Stochastic Modeling. Academic Press. NY. 1993.
Cinlar, E. Introduction to Stochastic Processes. Prentice Hall. NJ. 1975.
Heyman, D. and M. Sobel. Handbooks in Operations Research and Management Science. Vol. 2: Stochastic Models. North Holland. Amsterdam. 1990.
Ross, S. M. Stochastic Processes. Second Edition. University of California, Berkeley. New York.
JOHN WILEY & SONS, INC Romeu, J. L. RAC START: Vol. 11, No. 6: Availability. https://web.cortland.edu/matresearch/AvailabilitySTART.pdf
Romeu, J. L Operations Research/Statistics Techniques: a key to Quantitative Data Mining. FCSM Conference Proceedings. https://web.cortland.edu/matresearch/OR&StatsFCSMPaper.pdf

Jorge Romeu
Jorge Luis Romeu is an academic and researcher. He has taught Statistics and Operations Research at the college level for 40 years. Jorge graduated from the Universidad de la Habana in 1973 and emigrated to the U.S. in 1980, completing his Ph.D. at Syracuse University in 1990. His first Fulbright scholarship was in Mexico, where he served as a Fulbright-García Robles Senior Scholar in 1994. He has received several other Fulbright grants over the years, including multiple returns to Mexico as a Fulbright Specialist.


